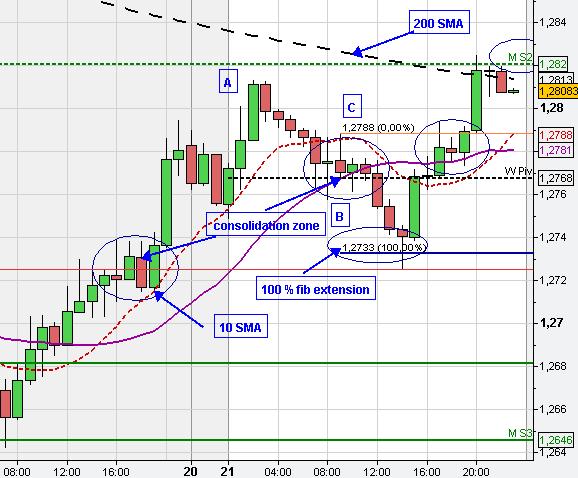
On the daily chart at 6 p.m. GMT we see that EUR/USD found resistance at the daily 10 SMA at about 1.2805 and pulled back from there to find some support at the 20 SMA (4 hour chart-purple line) and yesterdays consolidation price zone (1 hour chart below).
Furthermore, this price level got also supported from the 100 % fib extension from
A-B at C at about 1.2733 (1 hour chart below). The price bounced back strongly from the confluence support level and created a strong bullish candle (long price wick-4 hour chart-left), which closed right at the weekly pivot point at about 1.2768. Initially, after the 4 hour candle closed at 4 p.m. GMT (resistance level-weekly pivot-got touched/respected-
Timing) EUR/USD went up for one candle (
Breakout candle 2 on 5 min chart -last chart).
However, the Euro came back due to the resistance of the 20 SMA (purple line and prior consolidation zone on the 1 hour chart (4 p.m.-the doji) + 200 SMA on 5 min chart. From 4 p.m. to 5 p.m. GMT EUR/USD consolidated around the weekly pivot point (5 min chart) before price moved up again at 5 p.m. GMT (
Breakout candle 3 at 5 min chart) just after the prior 1 hour candle (starting at 4 p.m. GMT-doji) closed and respected the resistance level, particularly the 20 SMA on the hourly chart at about 1.2775. The 5 min chart also shows that market got supported due to the rising 20 SMA (last chart).
Finally, EUR/USD is closing right at the 10 SMA and monthly S2 resistance (respect the resistance zone).
 |
| 1 hour chart |
|
 |
| 5 min chart | |
Fibonacci Extensions
If we focus on the price development on the 5 min chart today from 1 p.m. and 6 p.m. we see that EUR/USD bounced back from the support level in a kind of V-shape pattern at 2.20 p.m. GMT.
In general, if a trend prevails then market often moves strongly in one direction then consolidates before market resumes the trend direction. Typical targets of the continuation are the 61.80 % (weak), 100 % (normal) and 161 % (strong) fib extensions.
The initial target is often the 61.80 % target where market is likely to react. In a strong trend market could easily ignore the 61.80 % level or only react on a shorter time frame and proceed directly to the 100 % fib extension which often provides solid support/ resistance, at least for a while. Very often price consolidates (smaller consolidation pattern than the prior consolidation) (bear/bull flag) at the 61.80 % fib extension before resumption.
However, if price is not at least consolidating at the 61.80 fib extension level and is instead bouncing back strongly into the prior consolidation (V-shape) then the underlying trend is in question (turn around or larger consolidation pattern). The last breakout is a false one/ shake out) to trigger stops and fool breakout trader, particularly at strong support/resistance levels, which only temporarily gets breached/ penetrated without confirmation.
V-shape turn around
On the 5 min chart, we have a small example of this kind of price rejection. If we focus on the small bear flag on the left of the 5 min chart after market dropped from the prior consolidation at point
a then it is observable that the last downward candles only reach the 61.80 % fib extension from
a-b at c and that price does not consolidate there but instead turns around and moves back into the consolidation pattern. Furthermore, no succeeding candle closes below the range of the
breakout candle 1 (no confirmation).
This kind of price behaviour ( V-shape turn around at the 61.80 % fib extension and/or non confirmation of the breakout candle is often observable before market either turns around or at least is starting a larger consolidation pattern.
We had another example of the V-shape turn around at a 61.80 % fib extension on the 18th of May (recent turn around) at the strong confluence support zone at about 1.2642 due to the 61.80 fib extension from the recent swing down + the weekly S3 (EUR/USD Market Update 18.05.12 -A-). Furthermore, the chance of a turn around of price at the support level got also increased due to the lower downward momentum of the second swing into support compared to the first swing down.


