Showing posts with label role. Show all posts

Saturday, 21 May 2016

Market Gap Trading - free forex day trading signals

,

Market Gap Trading ~ free forex day trading signals


Market Gaps Analyzed


Closing the Market Gap


 Day Trading Setups

1 hour Gap Trading 


The Euro gaped up to 1.2748 and from there EUR/USD started to move down and completely retraced/ closed the market gap and the market even fell much further.

The 2 a.m hourly candle found support at the 10 SMA (red line) and the Euro started to retrace up to 1.2725 supported by the rising hourly 10 SMA. After the end of the upward retracement the Euro resumed its downtrend and closed todays gap.

The 8 a.m. hourly candle respected (touched) the hourly 20 SMA (purple line) after the Euro consolidated between the 20 SMA and 200 SMA on the 5 min chart, and the Euro initially broke through the 20 SMA with the beginning of the new hourly candle at 9 a.m. (London open- green circle on 5 min chart).

The Euro found some temporary support at the pink line (low of January) and formed an abc-retracement up to the monthly pivot point. From there, the Euro bounced back and penetrated the pink line again but market could not confirm the breakout on the 5 min chart.

 Day Trading Setups

5 min  Daily Gap Trading Setups


More info for Market Gap Trading ~ free forex day trading signals:
Read more

Tuesday, 12 April 2016

Changing role of Support and Resistance - end of day forex trading signals

,

Changing role of Support and Resistance ~ end of day forex trading signals


Important levels and Patterns for Trading


Key Support/ Resistance


On the 4 hour and 1 hour chart we see that the Euro very often closed at (traded/ consolidated around) the low of January 2012 at 1.2624 key level, pink line), which coincides with the daily high of the 7th of June and the gap opening on Monday. Particularly on the 4 hour chart we see that every candle today closed at this important chart level.

euro chart analysis
4 hour Changing role from resistance to support

Daily Pivot Point S/R
1 hour Daily Pivot Point S/R

Head and Shoulders neckline


On the hourly chart we see that the Euro respected the 61.80 % fib extension at 5 a.m. (recent high) and price moved lower from there. On the 1 hour and 5 min chart (below) we see a nice Head and Shoulders pattern. At 11:15 a.m. the Euro breached the neckline (brown line) (A) but market could not confirm this breakout (first test).

The second break of the neckline occurred at 12:45 p.m. and market moved to the 100 % fib extension (B). EUR/USD breached the daily pivot point - key level-, however, the pivot point, the 4-hour 10 SMA and trend line (4-hour chart) supported the market. The Euro managed to close above the neckline on the hourly chart at 2 p.m. after a choppy price action between the neckline and the weekly pivot.

On the 5 min chart (below) we again see the importance of the pink line and its changing role from resistance to support vice versa -key Support/ resistance chart level. The Euro formed a bull flag on the 5 min chart and in the following closed above the pink line after market already regained the neckline with the hourly close at 2 p.m.. The Euro bounced back from the pink line at 5:25 p.m. (now support) and cleared the stops above the recent high (C). However, market could not close above the recent high on the 5 min chart at the first breakout (only stop fishing) and the Euro fell back again.

euro chart analysis bull flag
5 min Important Tradind Chart levels and Patterns

More info for Changing role of Support and Resistance ~ end of day forex trading signals:
Read more

Monday, 11 April 2016

Changing Role of Support to Resistance - free accurate forex trading signals

,

Changing Role of Support to Resistance ~ free accurate forex trading signals


Support and Resistance Trading


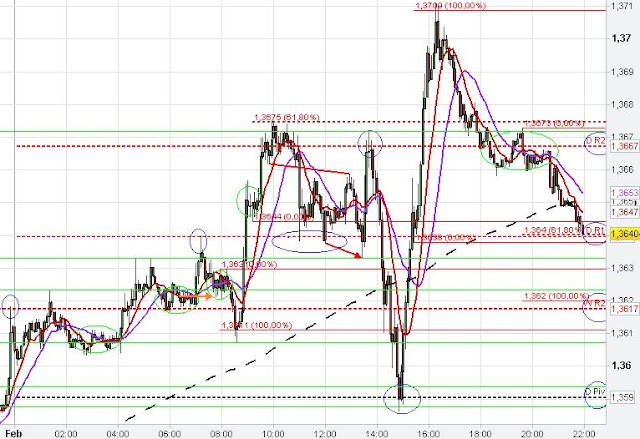
The Euro USD very often respected the different daily and weekly Pivot Points as support and resistance on the 5 min Intraday Chart. The daily Pivot Point held the sharp intraday downtrend after the Nonfarm payroll release today and the Euro USD reversed sharply up for new highs in the trading session. 61.80 % and 100 % Fibonacci extension levels also helped to determine intraday support and resistance zones.

The Euro moved only shortly into the 1.37 vicinity before retracing back. The daily R1, daily R2 and the weekly R2 beautifully show the changing role from resistance to support. The daily R1 was resistance at 7 a.m. GMT and after resistance got broken the resistance became support between 10 a.m. and 2 p.m.. Similarly, the daily R2 and the weekly R2 acted as resistance before the role changed depending on the vicinity of price action.  The chart formation at around 10 a.m. GMT might be seen as a small Head and Shoulder pattern at the daily R2 resistance.


changing role from resistance to support
5 min Changing role resistance to support


The below EUR/USD Chart shows how the monthly R2 Pivot point changed its role from resistance  (at 11 a.m.) to support after market broke this resistance level and confirmed the breakout at about 3 p.m..

Euro USD Pivot Points, S/R
5 min Resistance becomes support

More info for Changing Role of Support to Resistance ~ free accurate forex trading signals:
Read more

Tuesday, 22 March 2016

Pivot Point Trading - forex forecasts and trading signals

,

Pivot Point Trading ~ forex forecasts and trading signals


Daily and Weekly Pivots


Pivot Analysis


The hourly and the 5 min EUR/USD Chart below illustrates the importance of Pivot Points. The Euro traded between the weekly Pivot and the weekly Support 1. The weekly S1 provided support and the weekly Pivot acted as resistance.

Furthermore, the hourly Euro Chart shows a Continuation pattern (green ellipse - kind of Bear Flag). After market touched the 10 SMA  price went down, triggered the Continuation pattern and market price moved to the lower boundary of the trading range - weekly S1, whereby the Euro temporarily consolidated at the hourly 200 SMA (black dotted line).

The orange arrow shows that the consolidation price zone of the prior continuation chart pattern acted as resistance after the Euro temporarily breached the daily Pivot point and tested the consolidation price zone for the fist time. The second  test of the daily Pivot and the Consolidation price zone could not held the Euro (second test during a short time) and the market price moved further north to the upper boundary- the weekly Pivot point.

The 5 min chart below shows how the EUR/USD repeatedly failed to break the upper boundary (weekly Pivot). The lower boundary - weekly S1 - held after the unconfirmed break of the weekly S1, which created a kind of Hammer or Doji candlestick pattern on the chart. Another Continuation pattern and the 61.80 %  Fibonacci extension level are illustrated on the 5 min EUR/USD chart below.


Technical Chart Analysis EURUSD
1 hour Chart Analysis EURUSD - Pivot Points


Price Rejection Candle Hammer,Doji
5 min Candle Hammer, Doji and Pivot Points


Another Intraday example of the importance of the Pivot points on the 5 min EUR/USD Chart below


Trading Pivot Points in EURUSD


Pivot Point Support/ Resistance


The Pivot Points (Daily Pivot, Daily S1 and Daily R1) were important intraday Support and Resistance levels.


At 10:45 a.m. GMT market tested the daily Support 1. With the beginning of the new hourly candle at 11 a.m. the Euro tested the daily S1 again and market closed at this support level before breaking it for a short shakeout (Breakout Trading/ Timing with new candle-red circle). The same pattern approached at 4:25 p.m. at the daily R1.

The Euro formed a Continuation Chart Pattern at the daily Pivot Point before 2 p.m. (green ellipse) and market broke it with the new hourly candle. The breakout candle at 2:10 p.m. got confirmed due to the higher close of the succeeding candle above the high of the breakout candle.

The EUR/USD touched and successfully broke the daily R1 intraday Resistance. The confirmation of the breakout through the daily R1 led to a change from its role of resistance to support. The changing role from  resistance to support of the daily R1 can be seen after 3 p.m..


The continuation pattern at 4 p.m.(green circle) led to an unconfirmed breakout through the daily R1 after the 5 min candle at 4:25 p.m. closed at the daily R1 (red circle).


Euro Intraday Trading Levels
5 min Euro Pivot Trading Levels


More info for Pivot Point Trading ~ forex forecasts and trading signals:
Read more
 

Proven Forex Trading Robot Copyright © 2016 -- Powered by Blogger