Showing posts with label market. Show all posts

Sunday, 22 May 2016

Price target Pivots Fibonacci - world best forex trading signals

,

Price target Pivots Fibonacci ~ world best forex trading signals


Head and Shoulders neckline


Butterfly sell pattern


Chart pattern Price target


On the daily Chart of the EUR/USD we see a Head and Shoulders Chart pattern. The Euro closed at the brown neckline on the 5th of July and broke through the neckline on the next trading day, which triggered the Head and Shoulders pattern.


A close at Support/ Resistance levels, like the close at the Head and Shoulders neckline (blue circle), often weakens this Support/ Resistance level (see Breakout Trading/ Breakout Timing) so that a break of this S/R level (for a true breakout or a false breakout where price bounces back strongly - Stop Running and fooling breakout traders) is likely.


The target of the Head and Shoulders pattern is often the 100 % Fibonacci Extension level from the price range of the largest swing of the Head and Shoulders formation moved to the neckline break. The smaller 61.80 Fibonacci Extension level also led to a minor price reaction of the EUR/USD.

The EUR/USD bounced from this Head and Shoulders price target and started a strong upward leg after hitting the 100 % Fibonacci Extension price target of this chart pattern.

head and shoulder, butterfly pattern
Daily Head and Shoulder pattern


The 4 hour chart below shows that the recent up move in the EUR/USD market found resistance at the monthly S1, which coincided with the daily Resistance (pink line) and the consolidation price zone of the small and tight consolidation chart pattern on the left side of the 4 hour chart below. Hence, the level around the monthly S1 at 1.2388 was likely to lead to a price reaction due to the confluence of different resistance levels.


EURUSD chart analysis
4-hour Eur/Usd Chart Analysis


The 1 hour chart below emphasises the importance of Pivot Point analysis. The daily Pivot at 1.2243 led to a strong upward move and marks the low of todays trading range, whereby the daily R1 and the monthly S1 capped the market price besides the other reasons mentioned above.

The red ellipses show Breakout Timing setups, where market price closed at Support/ resistance before breaking it with the start of the new candle, whereby the blue ellipses are marking price reactions at important Support/ Resistance.

euro usd chart analysis
1-hour Eur/Usd Chart Analysis

The 5 min Euro Chart shows the importance of the daily Chart level at around 1.2290 where marked price reacted repeatedly. Furthermore, the daily chart level also changed its role between support and resistance repeatedly depending on price action in regards of true/ false price breakouts of this level.

In addition, there is a Butterfly sell pattern on the 5 min EUR/USD chart, which worked out very well. The failed breakout of the consolidation pattern (green circle) to the upside terminated at the monthly S1, which coincided with the 127 % Butterfly level, and price broke through the opposite consolidation boundary with strong momentum.


euro usd chart analysis
5-min Butterfly sell pattern

More info for Price target Pivots Fibonacci ~ world best forex trading signals:
Read more

EURUSD Market Pivot Point On April 30 (updated) - mb trading forex reviews

,

EURUSD Market Pivot Point On April 30 (updated) ~ mb trading forex reviews


HotForex Broker Promotion
EURUSD market Pivot Point results On April 30, 2015. This results was generated by using our HotForex tools. And this tool has been generated from the Floor Pivot points , Woodie Pivot Points, Camarilla Pivot Points, Demarks Pivot Points.

For other Currency market pivot points, please to use our tool here : Forex Pivot Point Tool Gerenator. I Hope it will be useful for you. Thanks for visiting my blog. Good luck in your trading Forex. Regard, Tom Berlino.


Auto generate pivot point tool for currency market of EURUSD.


EURUSD currency Market

More info for EURUSD Market Pivot Point On April 30 (updated) ~ mb trading forex reviews:
Read more

Saturday, 21 May 2016

Market Gap Trading - free forex day trading signals

,

Market Gap Trading ~ free forex day trading signals


Market Gaps Analyzed


Closing the Market Gap


 Day Trading Setups

1 hour Gap Trading 


The Euro gaped up to 1.2748 and from there EUR/USD started to move down and completely retraced/ closed the market gap and the market even fell much further.

The 2 a.m hourly candle found support at the 10 SMA (red line) and the Euro started to retrace up to 1.2725 supported by the rising hourly 10 SMA. After the end of the upward retracement the Euro resumed its downtrend and closed todays gap.

The 8 a.m. hourly candle respected (touched) the hourly 20 SMA (purple line) after the Euro consolidated between the 20 SMA and 200 SMA on the 5 min chart, and the Euro initially broke through the 20 SMA with the beginning of the new hourly candle at 9 a.m. (London open- green circle on 5 min chart).

The Euro found some temporary support at the pink line (low of January) and formed an abc-retracement up to the monthly pivot point. From there, the Euro bounced back and penetrated the pink line again but market could not confirm the breakout on the 5 min chart.

 Day Trading Setups

5 min  Daily Gap Trading Setups


More info for Market Gap Trading ~ free forex day trading signals:
Read more

Sunday, 8 May 2016

Will Gold hit 1000 before the year runs out - forex live trading room reviews

,

Will Gold hit 1000 before the year runs out ~ forex live trading room reviews


In recent weeks, Gold has been trending down rapidly breaking barriers along the way. Will this dip continue? Well its just a matter of time.


Going by the weekly chart,price broke out of a triangle in high momentum after 14 months of formation. This triangle marked the successful completion of wave 4 .

 Price is running down to complete this impulsive move which could end at 1000 ( the next support) before the year runs out


The intra day (H4) chart is not contradicting the bearish move. The bearish move that happened immediately after the triangle formation has successfully completed three waves.

 Presently, its enclaved in the triangle of its own which will be completed at the successful break of the lower boundary of the triangle.


In the other way, price might break the upper boundary of the H4 triangle to test the resistance at 1240 thereby forming a zigzag corrective pattern instead of the current triangle before resuming the bearish move.


The breakout of the H4 triangle is very important to what corrective pattern we could have. A break below it will make gold dip and head to 1000 while a break above it will test 1240.


As price moves further, i will keep an update. Dont be far.


Let me add you to my mailing list to alert you of my latest findings.Send your e-mail to forexmaster05@yahoo.com


More info for Will Gold hit 1000 before the year runs out ~ forex live trading room reviews:
Read more

Friday, 29 April 2016

Ending diagonal on Gbpchf - forex trading mentor reviews

,

Ending diagonal on Gbpchf ~ forex trading mentor reviews


I have some good runs on this pair and its stance to form patterns that I vividly understand makes me stay close to it.


Price is presently resuming the general bullish run which started in 2013. The general trend is Up! 


We saw the end of the 2nd wave zigzag corrective pattern and the resultant up move which broke  the resistance zone (indicated by the blue rectangle) showed that the correction is over and the trend has resumed upside.


Price is showing the end of wave 3 of the motive wave 3 with an ending diagonal which would make us expect a sharp corrective move downside. This resultant corrective move should end between 1.5430 and the support zone (1.5314-1.5280) before the bullish trend resumes.


Any dip below the support zone indicated will be a threat to the bullish trend.
I am expecting more price data/candles to ascertain the next big move
I will keep an update.


More info for Ending diagonal on Gbpchf ~ forex trading mentor reviews:
Read more

Sunday, 24 April 2016

Mr Prabakaran Feedback form Excellent course with perfect strategy for any market 100 must professional course - forex day trading tutorial

,

Mr Prabakaran Feedback form Excellent course with perfect strategy for any market 100 must professional course ~ forex day trading tutorial


Mr.Prabakaran Feedback form: Excellent course with perfect strategy for any market, 100% must professional course


FOREX TRADING / FOREX TRAINING / FOREX ACCOUNT OPENING
FOREX ACCOUNT OPENING CONTACT US
Mail : infoqmanager@gmail.com Skype : qmanager.live
Phone : 0091 9487929983 and 0091 9600329983
Whatsup: +91-9487929983 and viber: +91-9600329983
Facebook : www.facebook.com/forextamil4u
Youtube : www.youtube.com/user/senthamizharasuvta
website: www.tradingwithtamil.com and www.forextamil.com
Broker : http://business.evenforex.com/


Tags: forex students, forex training sessions, forex webinar, forex interview, fidelis broker

More info for Mr Prabakaran Feedback form Excellent course with perfect strategy for any market 100 must professional course ~ forex day trading tutorial:
Read more

Saturday, 23 April 2016

Market Manipulators cleared the stops - best forex day trading signals

,

Market Manipulators cleared the stops ~ best forex day trading signals


Taking out Stop orders


Hammer Candle Pattern


The Euro

candle pattern, doji, chart analysis
1-hour Clearing of  Stop Orders by Manipulators

gaped down to the monthly S2 Pivot in the Asian session and from there the Euro retraced up to the hourly 10 SMA.

The following downward swing terminated at 8:55 a.m. GMT at 1.2082 with the creation of a hammer candle pattern/ price rejection (5 min chart red ellipse).

The Euro moved up and slightly penetrated the recent high to reach 1.2139 (green line) before marked rolled over and then penetrated the recent low at 1.2082 (blue line). This price action was purely Stop Running. The Market Manipulators cleared the stops at the recent Highs and Lows (no confirmation on 5 min chart).

The relatively long 1 min breakout candle at 1:42 p.m. (not shown) suggests the clearing of many stop and pending limit orders. Market did not close below the recent low (1.2082-blue line) on the hourly chart. The clearing of the stops on both sides (low/ high) sometimes precedes larger moves as the mainstream traders are already stopped out or fooled into the wrong market direction.

In the US Session, the EURUSD Manipulators also cleared the stops above the new high with a slight breach of this level after market already took out the stop market orders at the low of todays market range.

The red ellipses on the hourly chart shows Breakout timing setups at 7 a.m. and 1 p.m.. The Euro closed at the monthly S2 (respecting support) and market moved below it with the beginning of the new hourly candle (Termination of the bear flag/ consolidation at 7 a.m..).

We will see whether the gap opening at 1.2156 (brown line) will be closed soon.


candle pattern, hammer, chart analysis
5 min Candle Pattern Hammer | Stop Running

More info for Market Manipulators cleared the stops ~ best forex day trading signals:
Read more

Usdcad Taking One More Push Upside - premium forex trading signals

,

Usdcad Taking One More Push Upside ~ premium forex trading signals


The price of Usdcad is predominantly determined by the crude oil markets. The negative correlation between them is so strong that as soon as oil price begins to fall, Usdcad immediately begins the rise in almost similar manner.

Since 2011, the trend of Usdcad has generally been bullish in what should be an impulse wave C of a cycle corrective ABC.

The C wave may have peaked at 1.3435 (100% fibonacci projection of wave A from B) but the impulse pattern doesnt look completed yet.

Price is probably in the 4th wave (a RUNNING FLAT corrective pattern shown in yellow) of the 5th wave of this impulse wave.


Price could rise in a 5th of 5th wave which would be expected to be the last push upside before the expected long term bearish move starts.

Price could rise to 1.4000 and 1.4255 price levels. The reaction at this level will detertmine whether the bears have a chance to drive price down in the long term.

Price should meanwhile be contained above 1.2770. A bridge of this level downward could mean that the 5th wave has already peaked at 1.3435 as earlier mentioned.

I favour more rally and only a bridge of 1.2770 will change my thought.

More info for Usdcad Taking One More Push Upside ~ premium forex trading signals:
Read more

Resistance becomes Support - how do forex trading signals work

,

Resistance becomes Support ~ how do forex trading signals work


Resistance/ Support levels


Changing Role of Resistance and Suppor


Day Trading Signals
1 hour Trading Signals  | Changing role Resistance to support

Resistance becomes support


On the 1 hour chart we see the changing role of the key level at 1.2588 (August 2010 low-orange line). Yesterday in the US session the Euro closed below this level at 3 p.m. GMT and in the following the Euro found resistance at the orange line. However, the Euro got supported by the hourly 200 SMA (black line) and the EUR/USD move above the orange line again in todays overnight session. Now, the orange line acted at support  (prior resistance becomes support) and the Euro did not close below this level on an hourly basis.

EUR/USD penetrated the orange line between 9 a.m. -10 a.m. but market bounced back again from the 200 SMA (yesterdays consolidation also provided some support at this price level) and closed finally above the key support on the hourly chart. From there, the Euro moved up to the next key level at 1.2624 (pink line-January low).

The Euro could not overcome this level for a while, however, EUR/USD also did not significantly bounced back from this resistance. The resistance got further strengthened due to the daily pivot at 1.2629. Market formed a bull flag on the hourly chart and the Euro broke through resistance (pink line) with the beginning of the 2 p.m. hourly candle after market repeatedly slightly penetrated this level during the three hour consolidation (bull flag-eroded resistance over time). Moreover, the bull flag terminated exactly at the 100 % time projection of the prior upswing (A-B at B, 5 min chart below).

After the break of the strong resistance (pink line) market gained strong bullish momentum. The 2 p.m. hourly candle closed above the weekly pivot, the 3 p.m. hourly candle above the monthly pivot and the 4-hour candle closing at 4 p.m. closed (respected) at the 61.80 % fib retracement and market breached the 61.80 % fib retracement initially after the 4 hour candle closed (red circle on hourly chart).

Day Trading Strategies
5 min Day Trading Strategies


On the 5 min chart we see that the Euro initially moved to the 61.80 % fib extension (A-B at C) after the breach of the pink line. The Euro found some resistance there and bounced back to find support at the rising 10 SMA (red line) on the 5 min chart and the Euro got repeatedly pushed up after touching the rising 10 SMA (strong bullish momentum).

The 5 min chart also highlights the changing role (support/resistance) of the orange line. EUR/USD repeatedly reacted at this level (1.2588).

More info for Resistance becomes Support ~ how do forex trading signals work:
Read more

Friday, 22 April 2016

Gbpusd Intraday Market Update - saxo bank forex trading reviews

,

Gbpusd Intraday Market Update ~ saxo bank forex trading reviews


I will be building on the analysis I did on 22nd of this month. You can scroll down the blog or click here. 


I noted an ending diagonal as part of the zigzag pattern that I thought could end wave 4 of the larger wave in order to be part of the potential large move downside.


I put a sell order at the break of the diagonal and soon market started moving up and down showing the diagonal might not have finished forming. A diagonal is usually followed by sharp moves


I exited the trade manually with -70pips in order to analyse more critically.


At the end of trade on 25th February, I saw that ending diagonal was still intact with double zigzags in between its legs. 


The fibonacci extension of wave A from B has pierced the 161.8% and price is now heading to 200% fibo extension level at 1.5560 and its neighborhood. 


This level could mark the last wave to complete the diagonal before a crash down.      A crash down could happen if the 200% level holds and price breaks below the support trendline of the diagonal.


Zooming down to the 15minute chart, something very interesting also surfaced.


    The supposed last wave of the expected diagonal formation, vividly seen on 15 minute chart is also forming a diagonal. 


This would be a massive move. That will be dual time diagonal formation.


If the 200% holds at the turning point, i would trade aggressively at the break of the 15 minute ending diagonal. 


A conservative way of trading is by waiting for the 1 hour diagonal to be broken downside by price. Proper stop order should be done with good money management.


I will see you in the next update.


Join my mailing list, send your e-mail address to forexmaster05@yahoo.com


More info for Gbpusd Intraday Market Update ~ saxo bank forex trading reviews:
Read more

Cadchf In a Triangle - forex trading machine review

,

Cadchf In a Triangle ~ forex trading machine review


On 23rd of september, I posted my view on this pair based on elliot wave analysis, you can read here.


Price has not been moving downwards as i forecast. With more price candles formed especially on the 4H chart, I have now come with an alternative wave count. Let me stress it that the two wave counts are still valid until price proves one correct and the other incorrect.


Price presently is consolidating in a triangle pattern and a break below it will support the bears and the first wave count will thereby be valid.


Going by the alternate wave count, the 5-wave bullish impulsive move explained in the first analysis might not be ended yet, It could be the wave 1 of the 5th wave of the impulsive move which started from 0.8400 support level and the present triangle could be wave 2 of 5.

 If the triangle is broken upside, price should continue the upside move to 0.8690-0.8700 which is a strong resistance.


Breakout of the triangle should decide the next medium term movement of this currency pair and I will watch out closely to be part of the move.


I am presently out of my bear position. I want to be sure of the next move before I join again.
I will keep an update of this pair as price movement unfolds


More info for Cadchf In a Triangle ~ forex trading machine review:
Read more

Sunday, 17 April 2016

Market News Trading - dux forex trading signals

,

Market News Trading ~ dux forex trading signals


FOMC News Release


News Trading in Forex


chart analysis fomc news release
1 hour Market News Release FOMC


The daily EUR USD trading high of  the 11th of June at 1.2669 is another key level (blue line). Today, the Euro found some support at this key level in the Asian and beginning of the European session (hourly chart above). The Euro USD traded in a tight range prior to the FOMC market news release.

On the 5 min chart (below) we see that market formed a kind of Head & Shoulders pattern (ABCDE). The break of the brown neckline got confirmed with the news release at 5:30 p.m. GMT.

Just prior to the news release at 5:25 p.m. the Euro Dollar bounced back from the 100 % fib extension from C-D at E and market closed in the trading range of the preceding 5 min candle.

 After the news release the Euro (5 min candle-5:30) initially moved down to the Head & Shoulders target at around 1.2665 (B-D at F - blue circle, F= neckline break), also 161% fib extension C-D at E. From there market bounced back before the Euro resumed its downtrend to the weekly pivot point where the Euro found strong support and moved up again.

The Eur USD found some resistance at the brown neckline (touched-respected it, red circle) before market finally broke the neckline to the upside with the beginning of the new hourly candle at 6 p.m.. The chance of a temporary continuation of the uptrend and a breach of the high of the 5 p.m. hourly candle got increased due to the 5 p.m. hourly rejection candle (long tail) and the hourly close at the neckline. The 6 p.m. hourly candle breached yesterdays trading high.


Volatile Trading Environment


The volatile market after the news release led to a clearing of the stops below and above todays "pre-new release" trading session, which is not untypical for a news release (stop fishing targets).

chart analysis fomc news release
5 min FOMC news trading


More info for Market News Trading ~ dux forex trading signals:
Read more

Thursday, 14 April 2016

Intraday Update on Eurusd - forex trading education reviews

,

Intraday Update on Eurusd ~ forex trading education reviews


On 21stNovember, I did an analysis on Eurusd, you can read here,when I discussed about an expected move of Eurusd down to the support zone ( 1.2150 and 1.8850) if the intraday zigzag channel is broken downward.


Price broke the channel mentioned above and is presently retracing to the neckline of the channel or ( 50% retacament of the intraday wave 3 to resume the bearish move to the expected zone before deciding what to do next.


If the present retracement happens to break 1.2600 upward, the bearish analysis is invalid


I presently have my pending sell position at 50% retracement of the most recent intraday bearish move


I will update you as it goes.


More info for Intraday Update on Eurusd ~ forex trading education reviews:
Read more

Monday, 11 April 2016

Changing Role of Support to Resistance - free accurate forex trading signals

,

Changing Role of Support to Resistance ~ free accurate forex trading signals


Support and Resistance Trading


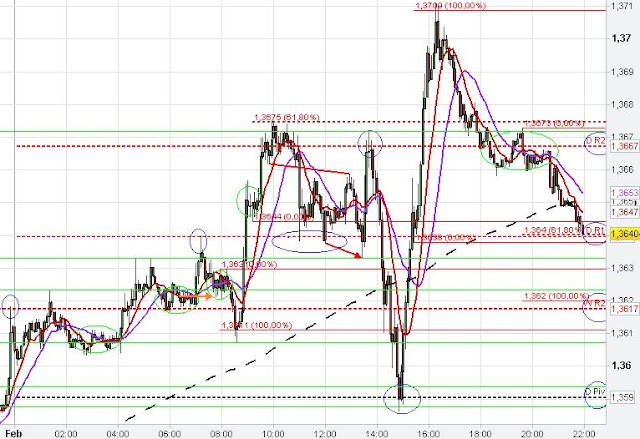
The Euro USD very often respected the different daily and weekly Pivot Points as support and resistance on the 5 min Intraday Chart. The daily Pivot Point held the sharp intraday downtrend after the Nonfarm payroll release today and the Euro USD reversed sharply up for new highs in the trading session. 61.80 % and 100 % Fibonacci extension levels also helped to determine intraday support and resistance zones.

The Euro moved only shortly into the 1.37 vicinity before retracing back. The daily R1, daily R2 and the weekly R2 beautifully show the changing role from resistance to support. The daily R1 was resistance at 7 a.m. GMT and after resistance got broken the resistance became support between 10 a.m. and 2 p.m.. Similarly, the daily R2 and the weekly R2 acted as resistance before the role changed depending on the vicinity of price action.  The chart formation at around 10 a.m. GMT might be seen as a small Head and Shoulder pattern at the daily R2 resistance.


changing role from resistance to support
5 min Changing role resistance to support


The below EUR/USD Chart shows how the monthly R2 Pivot point changed its role from resistance  (at 11 a.m.) to support after market broke this resistance level and confirmed the breakout at about 3 p.m..

Euro USD Pivot Points, S/R
5 min Resistance becomes support

More info for Changing Role of Support to Resistance ~ free accurate forex trading signals:
Read more

Saturday, 9 April 2016

Trading the Market High of (updated) - forex price action trading signals

,

Trading the Market High of (updated) ~ forex price action trading signals


EUR USD Market High


After the Euro USD broke out of the larger consolidation pattern on the daily chart last week market approached the high of 2012 yesterday at 1.3486. Market closed at the high of 2012 yesterday and today the Euro broke through it (Breakout Trading/ Timing- see red circle). A similar pattern occurred at the monthly R1 (red circle), where the daily candle also closed at the monthly R1 before market broke the monthly R1 with the next daily candle.
Currently, the Euro USD is trading at the monthly R2.


Daily Support/ Resistance
Daily - Support/ Resistance


Todays rise started with a kind of bull flag between 8 a.m. and 9 a.m.. The Euro USD rose to the monthly R2 at 11 a.m. where market temporarily found resistance. Market broke the monthly R2 with the beginning of the new hourly candle at 3 p.m.. The 5 min candle at 3 p.m. closed at the recent daily high and the next 5 min candle broke this resistance (red circle-Breakout Timing). The  monthly R2 changed its role from resistance to support and held the market so far. 


Euro USD Pivot Points, S/R
5 min Euro USD Pivot Points, S/R


More info for Trading the Market High of (updated) ~ forex price action trading signals:
Read more

Thursday, 7 April 2016

Market Range Trade Setups - trading signals forex peace army

,

Market Range Trade Setups ~ trading signals forex peace army


Trading a Sideways Market


Trading in a Range


Euro US Dollar market is in a sideways trading range.
Market is waiting for the Nonfarm Payroll Release on Friday, 01.02.2013.

The Euro US Dollar stayed in a sideways range and sideways market on the hourly time frame till now.

The daily Pivot Point and the weekly R1 Pivot held the market today. Fibonacci analysis and Pivot Points provided some possible trading setups in the sideways market to trade the market range in the EURUSD (see chart below).


Fibonacci studies and Pivot Points
5 min Fibonacci Setups and Pivot Point anaylsis


Another Example for a sideways trading range bound market


The Euro Dollar traded in the hourly consolidation range around the low of November 8th (see EURUSD Chart below).

The European session started with a Stop Run at 6 a.m. GMT. This false breakout on the 5 min Euro chart led to a price reversal of the EUR/USD. Market moved down to the 1.27 level in an impulsive move. However, market price action was capped in the range of this impulsive move during todays trading session.

At 1.10 p.m., the Euro Dollar reversed at the 1.2735 confluence resistance level because of the Fibonacci cluster due to the two 100 % fib extensions from the previous swings up, the daily pivot point and also the penetration of the recent high at 1.2730 on the 5 min chart (Stop Runs above recent high and the daily Pivot). The confluence resistance would have provided a good Trading Setup for a short entry in the market.


We had many continuation patterns (green circles-Pennants, Flags, Ledges), which could have guided todays trading setup decisions. Furthermore, the red circles show where the Breakout Timing strategy could have been applied and the orange arrows show where the Support/ Resistance through the consolidation price zones led to a market reaction. The Fibonacci trading levels also helped to find trading setups in regards of market turning points.


Trading Signals,Support,Resistance
5 min Trading Setups Euro Dollar


More info for Market Range Trade Setups ~ trading signals forex peace army:
Read more

Friday, 1 April 2016

GbpNzd Wave Analysis - fx trading reviews forex blog

,

GbpNzd Wave Analysis ~ fx trading reviews forex blog


There is no other thing that excites an elliotician more than seeing a wave pattern he can recognize on his chart. Such is what I have concerning Gbpnzd. 


If well followed, it will be rewardable.

From the daily chart, the upward move has already completed the first impulsive move ( leading diagonal) and its corrective wave ( running flat). 


The corrective running flat has been broken upside for wave 3 to emerge. with the thought that the third wave ( an expected 5-wave structure ) should at least expand to 161.8% extension of wave 1 from 2, this should happen at 1.4600 ( more than 4000 pips away) . 


Considering the fact that 1.4600 is a strong support turn resistance level, price getting to this level is possible.


We can watch price wave action in the lower intra day time frame in order to take trades piecemeal from this prospective trading opportunity.


On the 4 hour time frame, the price wave that broke out of the corrective flat pattern is running what looks like a 5-wave impulsive move. 


Presently congesting in a typical triangle pattern ( Wave 4 ). If the triangle is broken upside ( a trading opportunity), wave 5 will emerge before we see a large correction   ( a trading opportunity) . 


We will also trade the end of the correction if a recognized corrective pattern is formed to ride the trade up. 


There are potential opportunities for massive trades and the ability to follow through with patience and discipline will go a long way in the successful execution of these opportunities.

These are just forecasts, possibilities. Price will give us better information because its the captain of the army ; the rudder of the ship.


We check what price presents with what we have and make necessary adjustments and decision. 


I will be here for updates.

Forward any of your messages to Forexmaster05@yahoo.com


More info for GbpNzd Wave Analysis ~ fx trading reviews forex blog:
Read more

Thursday, 31 March 2016

EURUSD Market Pivot Point On April 28 (updated) - new science of forex trading reviews

,

EURUSD Market Pivot Point On April 28 (updated) ~ new science of forex trading reviews


HotForex Broker Promotion
EURUSD market Pivot Point results On April 28, 2015. This results was generated by using our HotForex tools. And this tool has been generated from the Floor Pivot points , Woodie Pivot Points, Camarilla Pivot Points, Demarks Pivot Points.

For other Currency market pivot points, please to use our tool here : Forex Pivot Point Tool Gerenator. I Hope it will be useful for you. Thanks for visiting my blog. Good luck in your trading Forex. Regard, Tom Berlino.


Auto generate pivot point tool for currency market of EURUSD.

EURUSD TRADING MARKET PIVOT POINT

More info for EURUSD Market Pivot Point On April 28 (updated) ~ new science of forex trading reviews:
Read more

Wednesday, 30 March 2016

A new look at Cadchf - day trading forex live reviews

,

A new look at Cadchf ~ day trading forex live reviews


Before I start,please take time to read my last post on this pair (click here).


Price broke the triangle I talked about and went back immediately giving me no real chance of buying.


The congestion is not looking over yet as we have price moving up and down to form a larger triangle.


As price adds up to itself, we ask ourselves, are we still in line?. Being able to follow price and allowing it to connect with us is very important. Thats why I chose elliot waves analysis as my primary tool.


With what price came up with of recent, it shows clearly that the first corrective wave ( wave 2) of wave 5 of the impulsive moves ( in blue) is about to be completed as a triangle corrective pattern. 

If this is anything to go by, we expect the price to break the upper line of the triangle for an explosive move upside. I will wait for a chance to buy at the break to target 0.8810.


Conversely, if price breaks the triangle downwards, what we will be having is a complex correction or temporary change in trend which requires more studies and patience.


Either way, price determines where it goes and we just have to understand him and follow. We should see a real action next week.


Connect with me on whatsapp: 2348134820569

Facebook: Sanmi Adeagbo

Twitter: @Forexelyte

BB Pin: 7FF79963

Let me also add you to my mailing list to alert you of my new post...                                                  E-mail: forexmaster05@yahoo.com


More info for A new look at Cadchf ~ day trading forex live reviews:
Read more

Wednesday, 23 March 2016

EURUSD Market Pivot Point On April 29 (updated) - forex trading for newbies review

,

EURUSD Market Pivot Point On April 29 (updated) ~ forex trading for newbies review


HotForex Broker Promotion
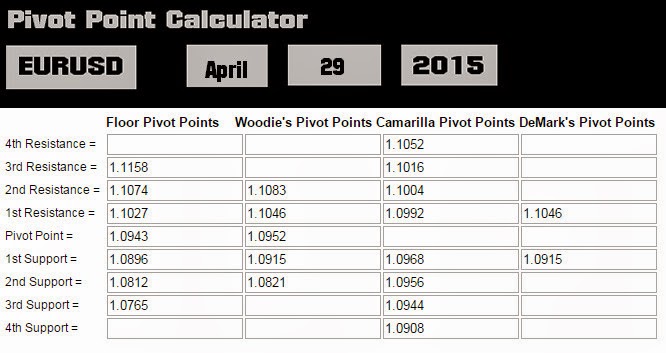
EURUSD market Pivot Point results On April 29, 2015. This results was generated by using our HotForex tools. And this tool has been generated from the Floor Pivot points , Woodie Pivot Points, Camarilla Pivot Points, Demarks Pivot Points.

For other Currency market pivot points, please to use our tool here : Forex Pivot Point Tool Gerenator. I Hope it will be useful for you. Thanks for visiting my blog. Good luck in your trading Forex. Regard, Tom Berlino.


Auto generate pivot point tool for currency market of EURUSD.


Forex trading Strategy EURUSD Market Pivot Points

More info for EURUSD Market Pivot Point On April 29 (updated) ~ forex trading for newbies review:
Read more
 

Proven Forex Trading Robot Copyright © 2016 -- Powered by Blogger